Standard Analysis Services at McDermott Bioinformatics Lab
At the McDermott Bioinformatics Lab, we offer comprehensive standard analysis services for various types of sequencing data. Our goal is to provide high-quality, reproducible results, with a focus on both data integrity and insightful interpretation.
Custom Analysis Services
In addition to our standard analysis offerings, we can tailor bioinformatics pipelines to meet the unique needs of your project. Custom analyses are designed for cases that fall outside the scope of our standard pipeline and may include:
- Custom Genome Mapping: Mapping to a non-standard genome reference
- Non-standard Software: Using software tools outside of our pipeline
- External Data: Data not generated by the McDermott Sequencing Core
- Re-analysis: Tweaking software parameters or incorporating additional data into the analysis
- Specialized Analyses: Any analysis not covered by general bioinformatics categories, such as RNA-Seq, ChIP-Seq, Exome sequencing, Amplicon sequencing, Gro-Seq, SmallRNA, or cancer-related sequencing
- Publication-ready Results: Generating high-quality charts, including heatmaps, volcano plots, and hierarchical clustering, tailored to your project’s needs
Advanced Analysis Options
We also provide in-depth analysis for specific scenarios, offering more detailed, manual interventions where automation may not be sufficient. For example:
- Exon Capture/Whole Genome: Custom analysis for specific gene sets or sequencing designs
- Pedigree-based Analysis: Analysis of familial relationships in sequencing data
- ChIP-Seq:
- Filtering enriched gene sets based on project-specific criteria
- Intersection/Union of peaks between conditions
- IP analysis and pathway analysis (e.g., IPA)
- RNA-Seq:
- Alternate sample combinations for differential expression analysis
- Intersection/Union of gene sets between samples/groups
- Further filtering of enriched gene sets based on project-specific criteria
- Pathway analysis (e.g., IPA)
- Xenograft Studies: Specialized analysis for xenograft experiments
If you have specific requirements that are not listed here, please get in touch with us to discuss how we can tailor our analysis to fit your project needs.
Single-cell Sequencing: Gaining Insights into Cellular Heterogeneity
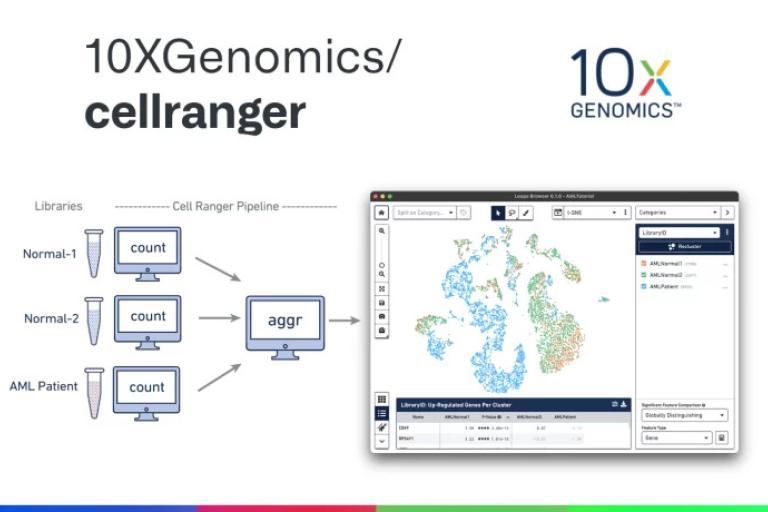
We provide analysis for single-cell sequencing data, including:
- Count Results: Available in the output folder
- Summary Reports: Sequencing, mapping, and sample information
- BAM Files: Sample-wise alignment data
- Cloupe Files: Visualization with Cloupe browser
- Multiomic Analysis: Secondary analysis results from Cell Ranger ARC
Single-cell sequencing technology has revolutionized our understanding of cellular heterogeneity in tissues and has enabled the identification of previously unknown cell types. This technique can be used to define new marker genes associated with specific cell types and identify subpopulations within known cell types based on gene expression profiles. Additional applications include studying cell lineage, understanding the regulation of differentiation, reconstructing cellular hierarchies, and inferring regulatory networks.
For further reading about single-cell sequencing technology and its analytical approaches, see the excerpt below from a recent publication:
An Overview of Single-cell Sequencing Analysis Pipelines
(Hwang, B., Lee, J.H., Bang, D., 2018. Single-cell RNA sequencing technologies and bioinformatics pipelines. Exp. Mol. Med. 50, 96)
Our Expertise in Single-cell Sequencing
The Sequencing Core and Bioinformatics Lab now offer single-cell sequencing using the Chromium 10X platform. For library preparation inquiries, please contact Vanessa Schmid.
At the Bioinformatics Lab, we provide data analysis tailored to the specific single-cell technology platform used. Since every single-cell experiment is unique, we highly recommend contacting us to discuss your experimental design. Please reach out via email for further assistance.
Why Choose Our Single-Cell Analysis Services?
Our team of experts brings extensive experience in single-cell bioinformatics, ensuring high-quality data processing, rigorous statistical analysis, and actionable insights. From experimental design to data visualization and interpretation, we provide end-to-end support tailored to your research needs.
By leveraging advanced tools and methodologies, we help you unlock the full potential of your single-cell datasets. Whether you are exploring fundamental biology, developing new therapies, or solving complex research questions, our lab is your trusted partner in single-cell analysis.
Applications of Single-Cell Analysis
Single-cell analysis has a wide range of applications across various fields, including:
Cancer Research: Identify rare tumor subpopulations and drug resistance mechanisms.
Neuroscience: Explore cellular diversity in the brain and mechanisms underlying neurological diseases.
Developmental Biology: Investigate the dynamics of cell differentiation and tissue development.
Immunology: Decipher immune cell interactions and responses to infections or therapies.
Collaborate With Us
Ready to advance your research with single-cell analysis? Contact us today to learn how our bioinformatics lab can provide cutting-edge solutions to your scientific challenges. Together, we can unravel the mysteries of cellular complexity and drive innovations in your field.
Introduction to RNA-Seq Analysis
RNA Sequencing Analysis
We process the following data for RNA sequencing:
- Raw Data: gzipped FASTQ files (unprocessed)
- Quality Control: FASTQC report with basic sequencing quality metrics
- Mapping & Alignment: Mapped BAM files (standard format) & alignment report
- Data Normalization: Bigwig files for coverage visualization
- Statistical Analysis:
- Clustering and dendrogram visualization
- MDS plot, MA plot, and Volcano plot
- EdgeR output for differential expression analysis
Introduction to RNA-Seq Analysis
RNA sequencing (RNA-Seq) has become a cornerstone technology for studying gene expression and understanding the transcriptomic landscape of biological samples. Our RNA-Seq analysis pipeline is designed to deliver robust, high-quality results, tailored to address a wide range of research questions.
What is RNA-Seq?
RNA-Seq is a next-generation sequencing (NGS) technique used to capture and quantify RNA molecules within a sample. This method enables the identification of genes that are actively expressed, the discovery of novel transcripts, and the characterization of isoforms, all at a genome-wide scale. By providing both qualitative and quantitative insights, RNA-Seq is a versatile tool for studying diverse biological systems.
Our RNA-Seq Analysis Workflow
At our bioinformatics lab, we employ a comprehensive RNA-Seq analysis pipeline that integrates state-of-the-art tools and methodologies to ensure accurate and insightful results. Key steps in our pipeline include:
- Reference Preparation: Constructing optimized references using the latest genome assemblies and annotation files to enhance alignment accuracy.
- Alignment and Quantification: Mapping raw sequencing reads to the reference genome, followed by quantification of gene and transcript abundance.
- Feature Counting: Summarizing read counts for genes and transcripts to facilitate downstream analysis.
- Differential Expression Analysis: Identifying genes and transcripts with significant expression changes between experimental conditions using statistical frameworks.
- Quality Control and Reporting: Generating detailed quality control reports to ensure data reliability and summarizing key metrics in user-friendly formats.
Applications of RNA-Seq
Our RNA-Seq pipeline supports a variety of research applications, including:
- Gene Expression Profiling: Understand how gene activity changes under different conditions.
- Differential Expression Studies: Identify genes and pathways impacted by experimental treatments or disease states.
- Transcript Discovery: Detect novel transcripts and alternative splicing events.
- Biomarker Identification: Discover potential diagnostic, prognostic, or therapeutic markers.
Why Choose Our Services?
With our expertise and state-of-the-art infrastructure, we provide a seamless RNA-Seq analysis experience. From experimental design to data interpretation, our team ensures that your data is processed with precision and analyzed with the latest bioinformatics approaches. We deliver actionable insights, high-quality visualizations, and comprehensive reports tailored to your research needs.
Collaborate With Us
Whether you are exploring fundamental biological processes, investigating disease mechanisms, or developing new therapies, our RNA-Seq analysis services can help you achieve your goals. Contact us today to learn more about how we can support your research endeavors.
Introduction to ChIP-Seq Analysis
For ChIP-Seq data, we provide:
- Raw Data: gzipped FASTQ files (unprocessed)
- Quality Control: FASTQC report with basic sequencing quality metrics
- Mapping & Alignment: Mapped BAM files
- Data Normalization: Normalized wiggle and bigwig files
- Quality Measures: PhantomPeakQualTools for ChIP-Seq quality assessment
- Analysis Outputs:
- HOMER-generated analysis output
- MACS2 peak calling files
- Peak annotation files
Chromatin Immunoprecipitation followed by sequencing (ChIP-Seq) is a powerful method for studying protein-DNA interactions. By combining chromatin immunoprecipitation with next-generation sequencing (NGS), researchers can identify binding sites of DNA-associated proteins, uncover epigenetic modifications, and explore regulatory elements across the genome. Our ChIP-Seq analysis pipeline is designed to provide reliable, high-quality results tailored to your specific research needs.
What is ChIP-Seq?
ChIP-Seq enables researchers to pinpoint where proteins bind on the DNA and map histone modifications or other epigenetic markers. This technique is invaluable for understanding gene regulation, epigenetic mechanisms, and chromatin dynamics. By uncovering protein-DNA interactions, ChIP-Seq sheds light on transcriptional regulation and chromatin organization.
Our ChIP-Seq Analysis Workflow
Our ChIP-Seq analysis pipeline integrates state-of-the-art tools and algorithms to ensure precise results and actionable insights. The key steps in our workflow include:
- Pre-processing:
- Quality control (QC) of raw sequencing data using tools like FastQC.
- Read trimming and filtering to ensure high-quality input data.
- Alignment of reads to the reference genome using advanced alignment algorithms.
- Removal or marking of duplicate reads to improve downstream accuracy.
- Quality Metrics:
- Assessing enrichment and signal-to-noise ratios with tools like PhantomPeakQualTools.
- Generating tag directories for enriched regions to facilitate further analysis.
- Peak Calling:
- Identifying regions of protein-DNA interaction or histone modification using peak-calling algorithms such as HOMER and MACS.
- Supporting both narrow peaks (e.g., transcription factor binding) and broad peaks (e.g., histone modifications).
- Annotation and Functional Insights:
- Annotating identified peaks to nearby genes or regulatory regions.
- Linking peaks to biological functions and pathways for meaningful interpretation.
- Comprehensive Reporting:
- Providing interactive visualizations and detailed QC metrics.
- Summarizing findings in a user-friendly report, ready for publication or further research.
Applications of ChIP-Seq
ChIP-Seq has a wide range of applications, including:
- Transcription Factor Binding: Mapping where transcription factors bind to regulate gene expression.
- Histone Modification Studies: Identifying epigenetic markers such as methylation and acetylation.
- Chromatin Structure Analysis: Investigating chromatin accessibility and dynamics.
- Gene Regulation: Understanding mechanisms of transcriptional activation or repression.
Why Choose Our Services?
With years of expertise in ChIP-Seq analysis and cutting-edge computational tools, we provide a seamless experience from raw data processing to insightful interpretation. Our workflows are customized to suit your experimental design, ensuring that the data is analyzed in line with your scientific objectives. Additionally, we offer comprehensive support for experimental planning and data reporting.
Collaborate With Us
Whether you are exploring transcriptional regulation, studying epigenetic landscapes, or investigating protein-DNA interactions, our ChIP-Seq analysis services can empower your research. Contact us today to discuss your project requirements and learn how we can assist you in achieving your research goals.
Introduction to CRISPR Analysis
We provide CRISPR screen analysis, including:
- Raw Data: gzipped FASTQ files
- Quality Control: FASTQC report
- Normalized Counts: sgRNA representation quantification
- Gene & sgRNA Summary: Results for comparisons
- Customized Analysis: Using tools like MAGeCK
CRISPR technology revolutionizes functional genomics, allowing high-throughput gene function exploration via precise genome editing. Our CRISPR analysis pipeline leverages industry-leading tools like MAGeCK to provide robust insights into gene knockouts, essentiality screens, and targeted mutagenesis experiments.
What is CRISPR Analysis?
CRISPR-Cas9 enables systematic gene perturbation, offering valuable insights into gene functions. When combined with sequencing, CRISPR screens identify genes involved in processes like proliferation, differentiation, and therapeutic responses. CRISPR analysis quantifies guide RNA (gRNA) representation and interprets the biological impact of gene perturbations.
Our CRISPR Analysis Workflow
We use a data-driven approach to analyze CRISPR screening data effectively. Key steps include:
- gRNA Quantification with MAGeCK Count:
- Map sequencing reads to reference libraries to identify gRNA sequences.
- Quantify gRNA abundance across experimental conditions.
- Generate high-quality count data for downstream analysis.
- Differential Analysis with MAGeCK Test:
- Compare gRNA abundance between treatment and control groups to identify enriched or depleted gRNAs.
- Identify candidate genes crucial for specific biological processes or phenotypes.
- Apply statistical models to reduce noise and enhance result reliability.
- Quality Control and Data Visualization:
- Conduct quality checks for data integrity and reproducibility.
- Visualize results using various plots, including boxplots, violin plots, and PCA.
Applications of CRISPR Analysis
CRISPR analysis is used in:
- Gene Essentiality Screens: Identifying genes vital for cell survival or proliferation.
- Drug Target Identification: Discovering genes related to treatment resistance or sensitivity.
- Functional Genomics: Understanding gene functions and their roles in complex traits.
- Disease Mechanisms: Investigating genetic drivers of diseases and therapeutic targets.
Why Choose Our Services?
Our CRISPR analysis services deliver precise and reliable results by utilizing MAGeCK and tailored workflows. From data processing to interpretation, we offer publication-ready insights, ensuring actionable findings that meet your research needs.
Partner With Us
Whether conducting genome-wide screens or targeted edits, our CRISPR analysis services provide the tools and expertise you need. Contact us to discuss your project and explore how we can advance your research.
Exon Capture/Whole Genome
Exome Sequencing Analysis
Our Exome sequencing services include:
- Raw Data: gzipped FASTQ files (unprocessed)
- Quality Control: FASTQC report with basic sequencing quality metrics
- Mapping & Alignment: Mapped BAM files
- Mapping Statistics: Detailed mapping statistics
- Metrics: PICARD metrics, coverage statistics (including plots, target region coverage, and mean coverage)
- Variant Calling: Annotated VCF and tab-delimited files for variant calls
Exon Capture or Whole Exome Sequencing is an efficient approach to sequencing the coding regions of the human genome. Many researchers are only interested in the regions that are responsible for protein coding i.e. 1-2 percent of the genome. It only makes sense to target these regions during sequencing, which guarantees a greater resolution and lower cost than Whole genome sequencing which aims to capture the entire genetic spectrum. In general, knowing the complete DNA sequence of an individual's genome does not, on its own, provide useful clinical information, but this may change over time as a large number of scientific studies continue to be published detailing clear associations between specific genetic variants and disease. Whole genome sequencing is also preferable when questions cannot be answered by looking only at the coding regions. This sequencing technique aims to decipher many different types of gene mutations including germline, somatic, insertions, deletions, and copy number variations, to name a few.
Most of the biologically significant events arise due to variations at the DNA sequence level. These sequence variations can be successfully correlated to various phenotypes, disease conditions, experimental conditions, etc. Identifying these sequence variants is the most fundamental feature of modern genomic studies. These changes can now be identified with confidence at a reasonable price using high throughput genomic sequencing. At the McDermott Sequencing Core, high-throughput genomic sequencing is done on Illumina machines and is available in two flavors: Whole Genome Sequencing and Exome Sequencing. Which of the two options should be chosen depends on the desired results.
Whole genome sequencing is mostly done when variations are expected at the whole genome level. These would include Structural Variations, Copy Number Variations, variations in Non-Coding regions, and other regions not targeted by Exome Sequencing. It is also used when the organism to be sequenced has a relatively smaller genome size or does not have exome capture kits available. Whole genome sequencing can be expensive and takes longer than Exome Sequencing. Many times the researchers are only interested in variants at exonic regions and these can be specifically sequenced at high coverage using Exome Sequencing. Exome Sequencing involves targeted exon capture and sequencing of the exome of an organism using various kits.
Our expertise in this field of genetic research includes geneticists, statisticians, and computational biologists. We provide cutting-edge sequencing, data analysis, and support to numerous researchers in UT Southwestern and beyond. The following is a basic workflow that we employ for the analysis of such data.
Please contact us if you would like more details about the workflow including specific parameters of the software, genome versions used, etc. Exome sequencing: the sweet spot before whole genomes (Teer and Mullikin, 2010) is an accessible introduction to exome sequencing.
Files provided with Exon Capture/Whole genome analysis
- Raw unprocessed gzipped FASTQ files
- FASTQC report with basic sequencing quality statistics
- Mapped BAM files (sorted -> low-qual filtered -> duplicates removed -> realigned -> recalibrated)
- Mapping statistics
- PICARD metrics
- Coverage statistics (plots, target region coverage, mean coverage, etc.)
- Annotated Variant calls in VCF formats and tab-delimited formats
Data is generated from the sequencing core using paired-end (PE) 100x100 sequencing, which is very important to get excellent mapping statistics. We also aim to provide at least 50x mean coverage and 95–98% over 20x coverage per base for each Whole Exome sample sequenced. This is the kind of coverage that would be necessary to have a statistically sound analysis if indeed substantive variations are found.
Kits
The type of kit used only pertains to targeted sequencing i.e. Exome Capture. There are numerous kits available each with their unique protocols and capture sizes. The kit that we use predominantly is the SureSelect All ExonV4, which has a capture region of 51Mb defined by CCDS, RefSeq, and GENCODE databases.
Demultiplexing
Multiple samples can be pooled into a lane using sample-specific barcode/index sequences. The Illumina sequencing machines have a read cycle that specifically reads these barcode sequences which are usually 6bp long. The data can then be accurately separated into their respective samples via demultiplexing. We use CASAVA to demultiplex a typical Illumina sequencing run. During demultiplexing, the adapters can be masked or left intact if the researcher choses to do so. There are two FASTQ files produced for each sample, one for each read.
Sequence Quality Accessing
At the Eugene McDermott Center for Human Growth and Development, we are most careful about the quality of data generated by the sequencers. The first check is to make sure we have enough sequencing for the analysis. If samples do not pass the threshold required for the number of reads, they will be resequenced. Other parameters include % Passing Filter, Mean Quality Score, and % of >=Q30 Bases to name a few. A detailed summary of the demultiplex stats used for initial Quality Accessing is available online.
Once samples pass initial sequencing quality metrics generated by the sequencers, they are assessed by FASTQC which checks for per-base sequence quality, GC content, and N content, among others. If the data indeed looks sub-par, they will be immediately reprepped and resequenced. Data contamination is checked using FastQ Screen.
Data trimming is done if needed using any one of:
Our quality control process also included assessing per base coverage, mean coverage, and on-target percentages, among others. These will be discussed in the Useful Metrics section.
Samples that pass QC are finally ready to be mapped and analyzed. The researchers will be consulted on what genome version they would like to map to, although the default would be to use the latest version available. On special request, we can try to use an older genome or even a custom one.
Align reads
Reads are mapped to the reference genome using the Burrows-Wheeler Alignment Tool BWA and the output is produced in BAM format. The mapping workflow is synonymous to the workflow employed by the 1000genomes project. Using other software is not out of the question if the experiment needs it. We have a very high mapping rate given the high-quality sequencing at the McDermott Center, using almost all of the data produced!
Remove duplicates
Duplicates are removed from the mapped data using PICARD and reads with quality less than a Phred score of 10 are also filtered out. This leaves us with an alignment file with analysis-ready data.
Once the data has been mapped and filtered, we follow the best practices workflow created by The Broad Institute for their GATK software. This includes everything from data pre-processing, variant discovery, and preliminary analyses for cohorts of samples. In order to have enough power for all exome sequencing analyses, we require at least 30 samples for joint variant calling. If an experiment has less than 30 samples, we will use a random mix of samples from the 1000genomes project to increase power during variant calling and variant recalibration.
GATK
The GATK Toolkit is the industry standard when it comes to SNP and Indel mutation analyses. It can be applied to all kinds of datasets and genomes. It comes with a host of tools that can be used for data alignment refinement, coverage analysis, diagnosis, and mainly variant calling. GATK variant calling can be run in two modes, the UnifiedGenotyper mode or HaplotypeCaller mode. By default, we run both the modes and provide a union of the two results. The variants found are then optimized using GATK re-calibrator tools. Please visit their page for more in-depth information about the software. Both the raw SNP/INDEL calls as well as the recalibrated files are provided.
Variants detected by GATK are then annotated using snpEff. Annotations are incorporated in the VCF file and also presented as a user-friendly TAB file, one for each sample as well as a joint table containing the whole experiment. Annotations include:
| COLUMN IDENTIFIER | DESCRIPTION |
|---|---|
| CHROM | The chromosome of the variant |
| POS | The genomic location of the variant |
| REF | Reference base |
| ALT | Alternate base |
| VariantType | Type of variant (SNP or INDEL) |
| ID | rsID of dbSNP, if present |
| dbSNPBuildID | The version of dbSNP the variant was first found in |
| SNPEFF_GENE_NAME | Gene name for the highest-impact effect resulting from the current variant |
| Set | (UNI: called by Unified Genotyper; HC: Called by HaploType Caller; Intersection: Called by both callers) |
| SampleName.GT | Genotype |
| SampleName.AD | Allelic Depth |
| SampleName.GQ | Genomic Quality |
| SNPEFF_EXON_ID | Exon ID for the highest-impact effect resulting from the current variant |
| SNPEFF_FUNCTIONAL_CLASS | Functional class of the highest-impact effect resulting from the current variant (NONE, SILENT, MISSENSE, or NONSENSE) |
| SNPEFF_AMINO_ACID_CHANGE | Old/New amino acid for the highest-impact effect resulting from the current variant |
| dbNSFP_Uniprot_acc | Uniprot accession number. Multiple entries separated by ";"/td> |
| dbNSFP_SIFT_score | SIFT score (SIFTori). The smaller the more damaging. Multiple scores separated by ";" |
| dbNSFP_Polyphen2_HDIV_score | Polyphen2 score based on HumDiv, i.e. hdiv_prob. The score ranges from 0 to 1, and the corresponding prediction is "probably damaging" if it is in [0.957,1]; "possibly damaging" if it is in [0.453,0.956]; "benign" if it is in [0,0.452]. Score cutoff for binary classification is 0.5, i.e. the prediction is "neutral" if the score is smaller than 0.5 and "deleterious" if the score is larger than 0.5. Multiple entries separated by ";". |
| dbNSFP_GERP_RS | GERP++ RS score, the larger the score, the more conserved the site. |
| SNPEFF_IMPACT | Impact of the highest-impact effect resulting from the current variant (HIGH, MODERATE, LOW, or MODIFIER) |
| GAF | Global Allele Frequency based on AC/AN (1000 Genomes) |
| AFR | African Allele Frequency (1000 Genomes) |
| AMR | American Allele Frequency (1000 Genomes) |
| ASN | Asian Allele Frequency (1000 Genomes) |
| EUR | European Allele Frequency (1000 Genomes) |
| AA_AC | African American Allele Count in the order of AltAlleles,RefAllele. For INDELs, A1, A2, or An refers to the N-th alternate allele while R refers to the reference allele. (EVS) |
| EA_AC | European American Allele Count in the order of AltAlleles,RefAllele. For INDELs, A1, A2, or An refers to the N-th alternate allele while R refers to the reference allele. (EVS) |
| GWASCAT | Trait related to this chromosomal position, according to GWAS catalog |
| CLOSEST | Closest Splice Site in bps (0 if variant is exonic) |
| CA | Clinical Association (EVS) |
snpEff
snpEff is a Genetic variant annotation and effect prediction toolbox. It annotates and predicts the effects of variants on genes along with making the addition of custom annotations possible. The Broad Institute is a user of the snpEff toolbox and through collaboration has made GATK compatible with this highly efficient annotator. Please view their webpage for additional details.
It is imperative that any sequencing/analysis done at the McDermott Center have the highest standards of data quality. This includes not just sequencing quality statistics, but also experiment quality statistics which are equally important. For this purpose, we use a set of tools that is part of the PICARD tool-set as well as diagnosis tools from GATK.
Coverage
Good coverage is very important in order to be confident about the variants being called. We check each sample individually to make sure that they meet our minimum thresholds of at least 50x average coverage and 95%-98% over 20x coverage. A per target coverage table is provided as well as a diagram of the percentage bases covered with X coverage.
SMRT-Sequencing
The principle of PacBio SMRT sequencing:
The PacBio sequencing uses the SMRT (Single molecule Real-Time Sequencing Technology) to sequence log reads with uniform coverage. The SMRT technology uses the zero-mode waveguide (ZMW) nanostructure to sequence the DNA.
Precisely, within ZMW chamber, a molecule of DNA polymerase and DNA template to be sequenced is adsorbed to the bottom of the base, and nucleotides tagged with fluorescent molecules are released. The light is shined from the below ZMW chamber. Only the very bottom of the detection chamber is reached by the decaying light, meaning only the DNA polymerase molecule and whatever base that is currently attached to it can be illuminated and detected.
Library preparation
(Library Prepration workflow)
* Please Email Vanessa Schmid at the sequencing core for pricing information
Application areas of SMRT sequencing
- Whole genome sequencing
- RNA sequencing
- Targeted Sequencing
- Epigenetics
- Metagenomics
How the sequencing works
Principle of single-molecule, real-time DNA sequencing
(source : Eid J., Fehr A., Gray J., Luong K., Lyle J., Otto G., Peluso P., Rank D., Baybayan P., Bettman B., et al. Real-time DNA sequencing from single polymerase molecules , Science, 2009, vol. 323 (pg. 133-138))
The SMRTbell (grey) as produced in the last step of library preparation is diffused into a ZMW well and adapter binds to a polymerase immobilized at the bottom of the well. Million such wells are present in the sequel system. To maximize the throughput, each well must receive one such SMRTbell.
In the above figure, four types of nucleotides are labeled with different fluorescent dyes. 1) a nucleotide forms an association with the template strand at the polymerase active site. 2) this causes fluorescence at the site which is captured in color channel 3) after the formation of phosphodiester bond, the dye diffuses out of the well thus ending fluorescence 4) polymerase then translocates to the next position 5) next nucleotide forms an association at the polymerase active site.
Bioinformatics analysis
SMRT sequencing enables various types of bioinformatics analysis such as:
- De Novo Assembly
- Transcriptome analysis
- Base Modification analysis
- Minor variants and phasing analysis
For bioinformatics analysis, we highly recommend that you come by our lab or contact us so that we can discuss the details of your experiment.
Features of the PacBio Sequel Systems
| Supported SMRT Cell | SMRT Cell 1M |
|---|---|
| Number of HiFi Reads >99%* Accuracy | Up to 500,000 |
| Sequencing Run Time per SMRT Cell | Up to 20 hrs |
| Recommended Chemistry | 3 |
| Instrument Control Software | v8.0 |
| SMRT Link | v8.0 |
Advantages of SMRT Sequencing
- Single molecule resolution
- Long read
- Speed
- High accuracy
This PacBio paper provides an overview of the advantages of SMRT sequencing
References
- PacBio, Sedlazeck, Fritz J et al. (2018) Genetic variation and the de novo assembly of human genomes. Nature reviews. Genetics
- Application of PacBio, Rhoads, Anthony et al. (2015) Real-time DNA sequencing from single polymerase molecules, Science, 2009, vol. 323 (pg. 133-138)
Knowing how important this specific area of research is, we are actively developing a pipeline specially tailored for cancer studies. The pre-processing of the data is very much similar to the steps mentioned in the Exon Capture/Whole Genome analysis section.
Since data analysis for cancer is very project specific, the software and methodology for the analysis may vary. We have experience with the tools mentioned in the workflow diagram below to detect low-frequency point mutations, indels, large deletions and insertions, copy number variations, inversions, etc. Ultimately, the tool for analysis is dependent on the question that needs to be answered.
The McDermott Center Bioinformatics Lab provides free data analysis unless the circumstances mentioned in the Custom Analysis section are in effect. If you need further analysis, please contact us and we can discuss the details. We welcome consulting, provide customized service, and promote collaboration.
We highly recommend that you come by our lab so we can discuss the details of your results and your experiment. Not every experiment follows general guidelines for analysis and we are confident that with more understanding of your research, we will be able to help you reach your goals.
Our Q&A sessions are every Thursday, from 2–4 p.m. in NA 2.226. If this time is not convenient for you, please email us and we will set up a meeting that better fits your schedule.
Our Q&A sessions are every Thursday, from 2:00-4:00 pm (NA 2.226). If this time is not convenient for you, please contact us and we will set a meeting that better fits your schedule. Please do so ahead of time so we can be prepared for our meeting. If we are doing analysis for your data, please make it a priority to discuss as many details about your experiment with us as you can. Not every experiment follows general guidelines for analysis and we are confident that with more understanding of your research, we will be able to help you reach your goals.
The following should give you an idea of what our bioinformatics pipeline has been configured to. Of course, these can be changed as per the researcher’s needs. Please contact us for individual inquiries.
| Species | Experiment | Genome version | Provider |
|---|---|---|---|
| Human | Whole exome/genome | b37 | Broad/NCBI |
| Human | RNA-Seq/ChIP-Seq | hg19 | UCSC |
| Mouse | Whole exome/genome | GRCm38 | NCBI |
| Mouse | RNA-Seq/ChIP-Seq | mm10 | UCSC |
| Rat | RNA-Seq/ChIP-Seq | rn5 | UCSC |
| Fly | Whole genome/RNA-Seq/ChIP-Seq | dm3 | UCSC |
| Zebrafish | RNA-Seq/ChIP-Seq | danRer7 | UCSC |
| Neurospora | Whole genome | NC12 | Broad |
| Yeast | RNA-Seq/ChIP-Seq | sacCer3 | UCSC |
Yes, we can. Please contact us for individual inquiries.
Data QC mapping and basic analysis are free of charge if it is generated in the McDermott Sequencing core and within the scope of our standard pipeline. If custom analysis is needed, we can negotiate on a per sample, per project, hourly or collaborative basis depending on your needs.
If the data only needs basic analysis, please allow up to 1 week. We try not to rush the data as they need to go through a rigorous QC benchmark. If you are under a time crunch, please contact us and we will try our best to expedite the processing.
If you are part of the UTSW network, the data can be downloaded/viewed from the link that we send you.
In such cases, either an FTP link can be provided or a hard drive can be shipped to your location.
Your data and links are stored for one month in our storage. It is imperative that you copy the data during this time. We will send out an e-mail when your data is ready and another one before your data expires to make sure that you are aware of this.
This is usually the case. During submission of your samples, please be specific that only raw data is needed.
Your demultiplexed raw data is in gzipped FASTQ format. The qualities are encoded in Sanger format (Q33/Illumina 1.9).
Such requests need to be arranged with the sequencing core itself.
We allow at 0 mismatch during demultiplexing of the data.