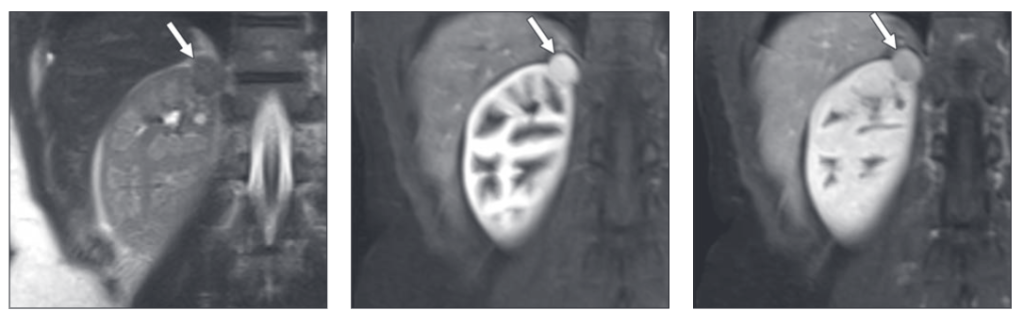
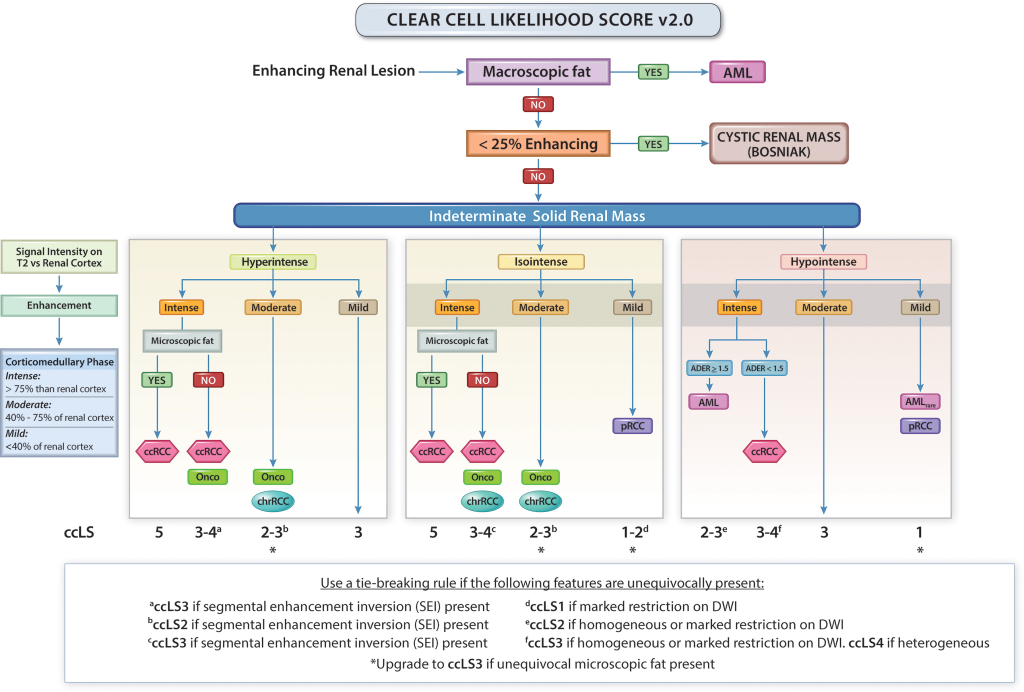
How We Do It: Managing the Indeterminate Renal Mass with the MRI Clear Cell Likelihood Score
The clear cell likelihood score (ccLS) derived from multiparametric MRI is useful in noninvasively identifying the clear cell subtype, the most common and aggressive form of kidney cancer. In this manuscript, we review the ccLS system, including a step-by-step guide for image interpretation and additional guidance for its implementation in clinical practice.
Pedrosa, et al. Radiology 2022
Multicenter Evaluation of Multiparametric MRI Clear Cell Likelihood Scores in Solid Indeterminate Small Renal Masses
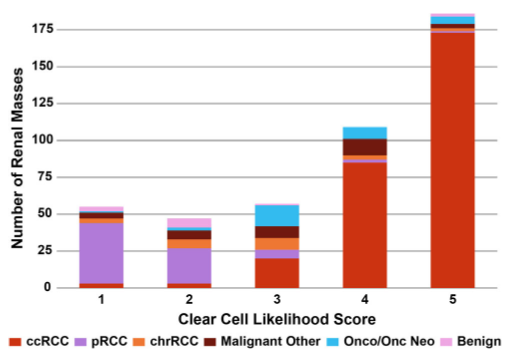
This retrospective multicenter cross-sectional study included patients with consecutive solid (≥25% approximate volume enhancement) SRMs undergoing multiparametric MRI at five academic medical centers with histologic confirmation of diagnosis. 250 solid SRMs were evaluated. The sensitivity, specificity, and positive predictive value for the diagnosis of ccRCC when ccLS was 4 or higher were 75% (95% CI: 68, 81), 78% (72, 84), and 76% (69, 81), respectively. The negative predictive value of a ccLS of 2 or lower was 88% (95% CI: 81, 93).
Schieda, et al. Radiology 2022
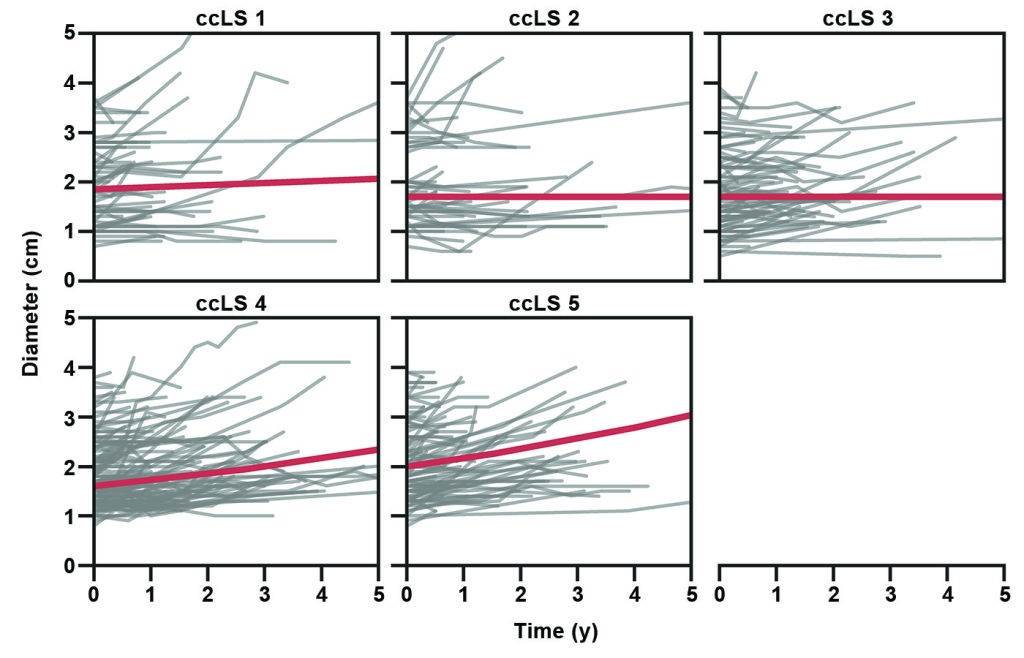
Association of Clear Cell Likelihood Score on MRI and Growth Kinetics of Small Solid Renal Masses on Active Surveillance
Growth rates of 386 small renal masses (SRMs)(100 ccLS 1–2, 75 ccLS 3, and 211 ccLS 4–5) from 339 patients (median age, 65 years; 198 men, 141 women) were analyzed. Median follow-up was 1.2 years. The ccLS was correlated with growth rates by size (ρ = 0.19; p < .001; ccLS 4–5, 9%/year; ccLS 1–2, 5%/year; p < .001) and by volume (ρ = 0.14; p = .006; ccLS 4–5, 29%/year; ccLS 1–2, 16%/year; p < .001). Growth is associated with ccLS in SRMs, with higher ccLS correlating with faster growth.
Rasmussen, et al. AJR Am J Roentgenol 2022
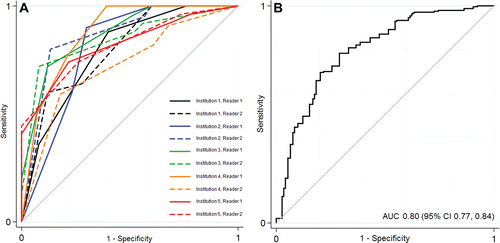
Prospective Performance of Clear Cell Likelihood Scores (ccLS) in Renal Masses Evaluated with Multiparametric Magnetic Resonance Imaging
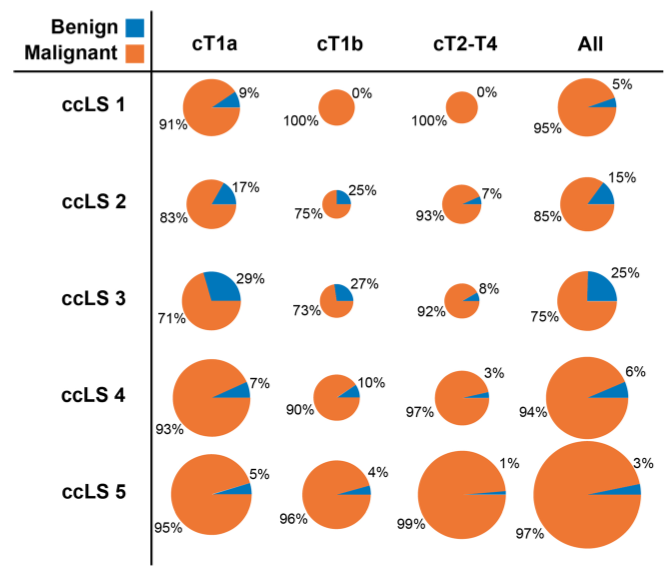
The positive predictive value of the clear cell likelihood score (ccLS) for detecting clear cell renal cell carcinoma (ccRCC) is 5% (ccLS1), 6% (ccLS2), 35% (ccLS3), 78% (ccLS4), and 93% (ccLS5). Sensitivity of ccLS>4 and specificity of ccLS<2 were 91% and 56%, respectively. When controlling for confounding variables, ccLS is an independent risk factor for identifying clear cell renal cell carcinoma.
Steinberg, et al. Eur Radiol 2021
Diagnostic Performance of Prospectively Assigned Clear Cell Likelihood Scores (ccLS) in Small Renal Masses
This study confirmed that multiparametric MRI can reasonably identify clear cell renal cell carcinoma. The standardization of MRI acquisition protocols and reporting criteria such as the ccLS algorithm can be used to aid in the diagnosis and management of small renal masses.
Johnson, et al. Urol Oncol 2019
Diagnostic Performance and Inter-Reader Agreement of the Clear Cell Likelihood Score (ccLS) Algorithm for the Histologic Diagnosis of Small Renal Masses
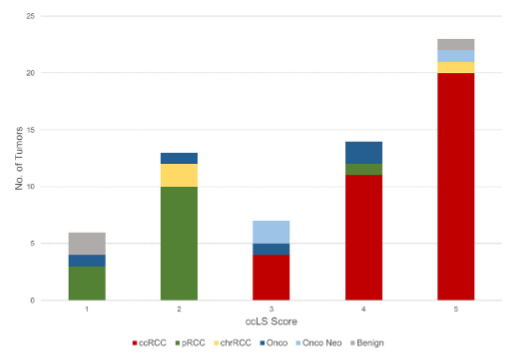
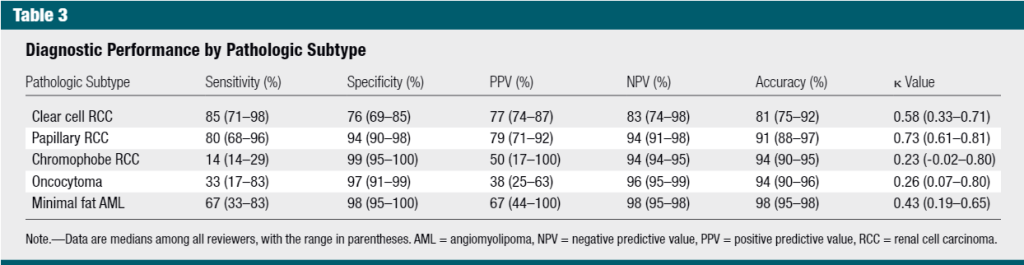
The ccLS algorithm offers a diagnostic accuracy of 81% and 91% in the diagnosis of clear cell RCC and papillary RCC, respectively, while achieving moderate to substantial interreader agreement among multiple radiologists.
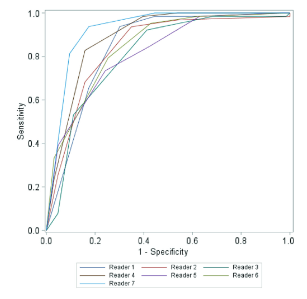
Kay, et al. Radiology 2018
Diagnostic Accuracy of Multiparametric MRI to Identify Clear Cell Renal Cell Carcinoma in cT1a Renal Masses
A clear cell likelihood score used with MRI can reasonably identify clear cell histology in small renal masses and may decrease the number of diagnostic renal mass biopsies. This approach facilitates standardization of imaging protocols and reporting criteria to improve interobserver reliability.
Canvasser, et al. J Urol 2017
Role of the Virtual Biopsy in the Management of Renal Masses
Learn about the emerging role of imaging to provide a comprehensive noninvasive characterization of a renal mass — so-called "virtual biopsy" — and its potential use in the management of patients with renal tumors.
Diaz de Leon, et al. AJR 2019